


The state of edtech during COVID 19


Online learning barometer
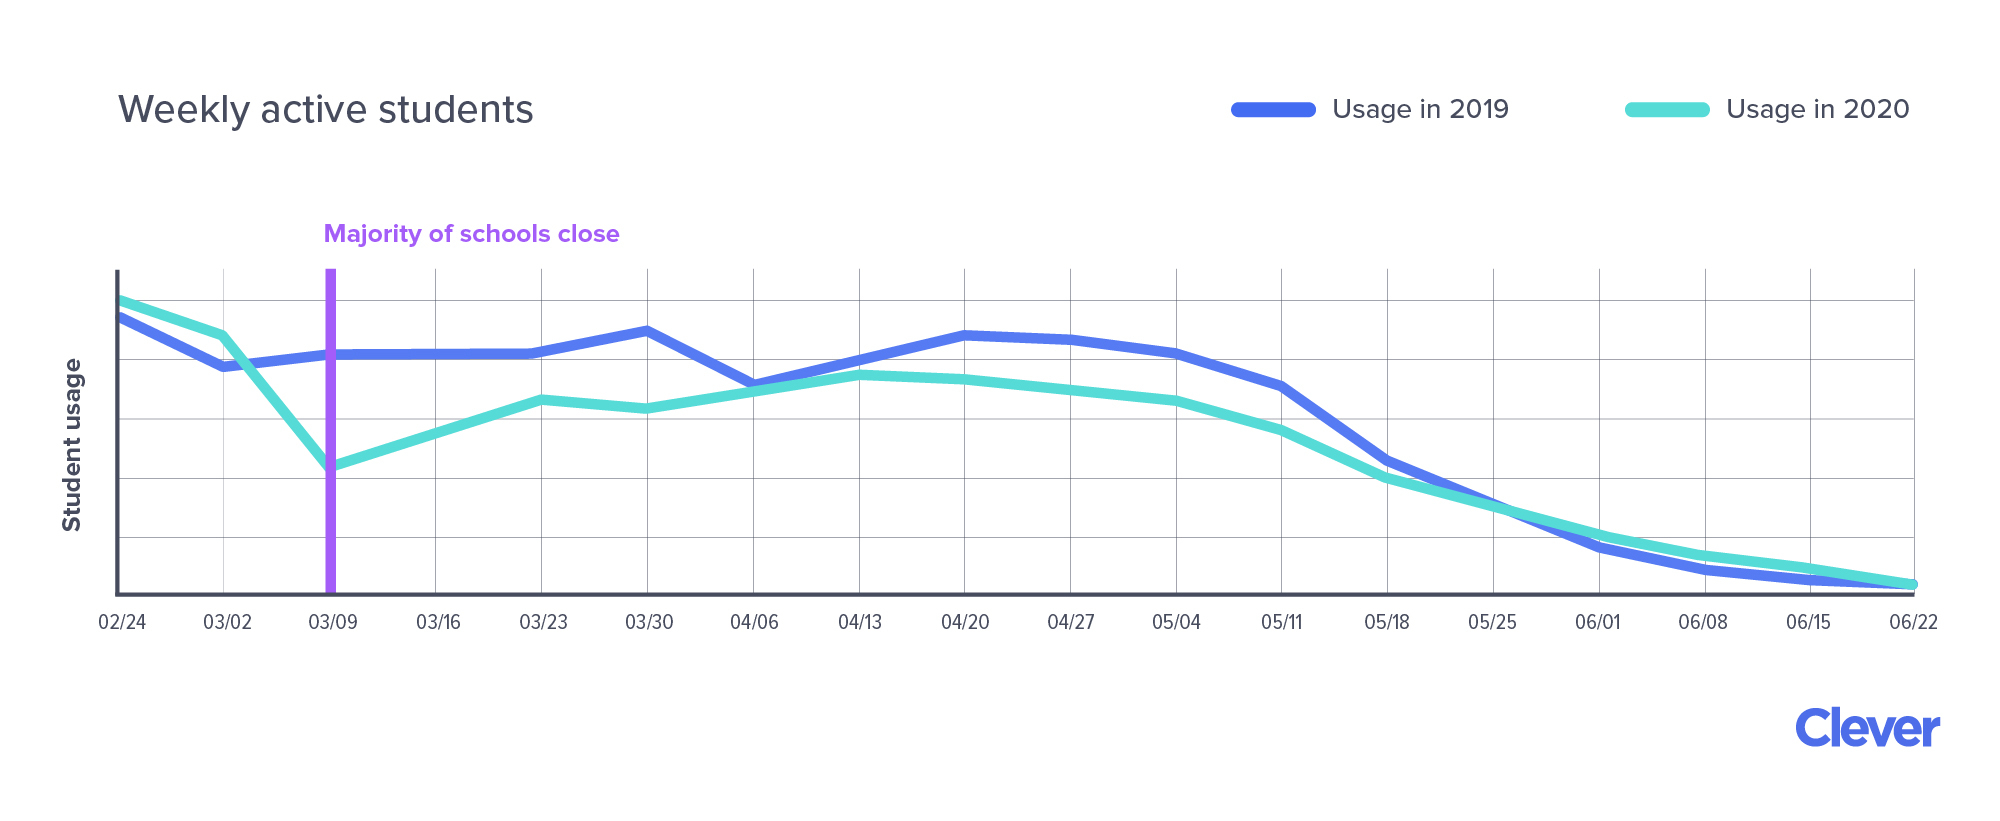
Student activity dropped, then stabilized
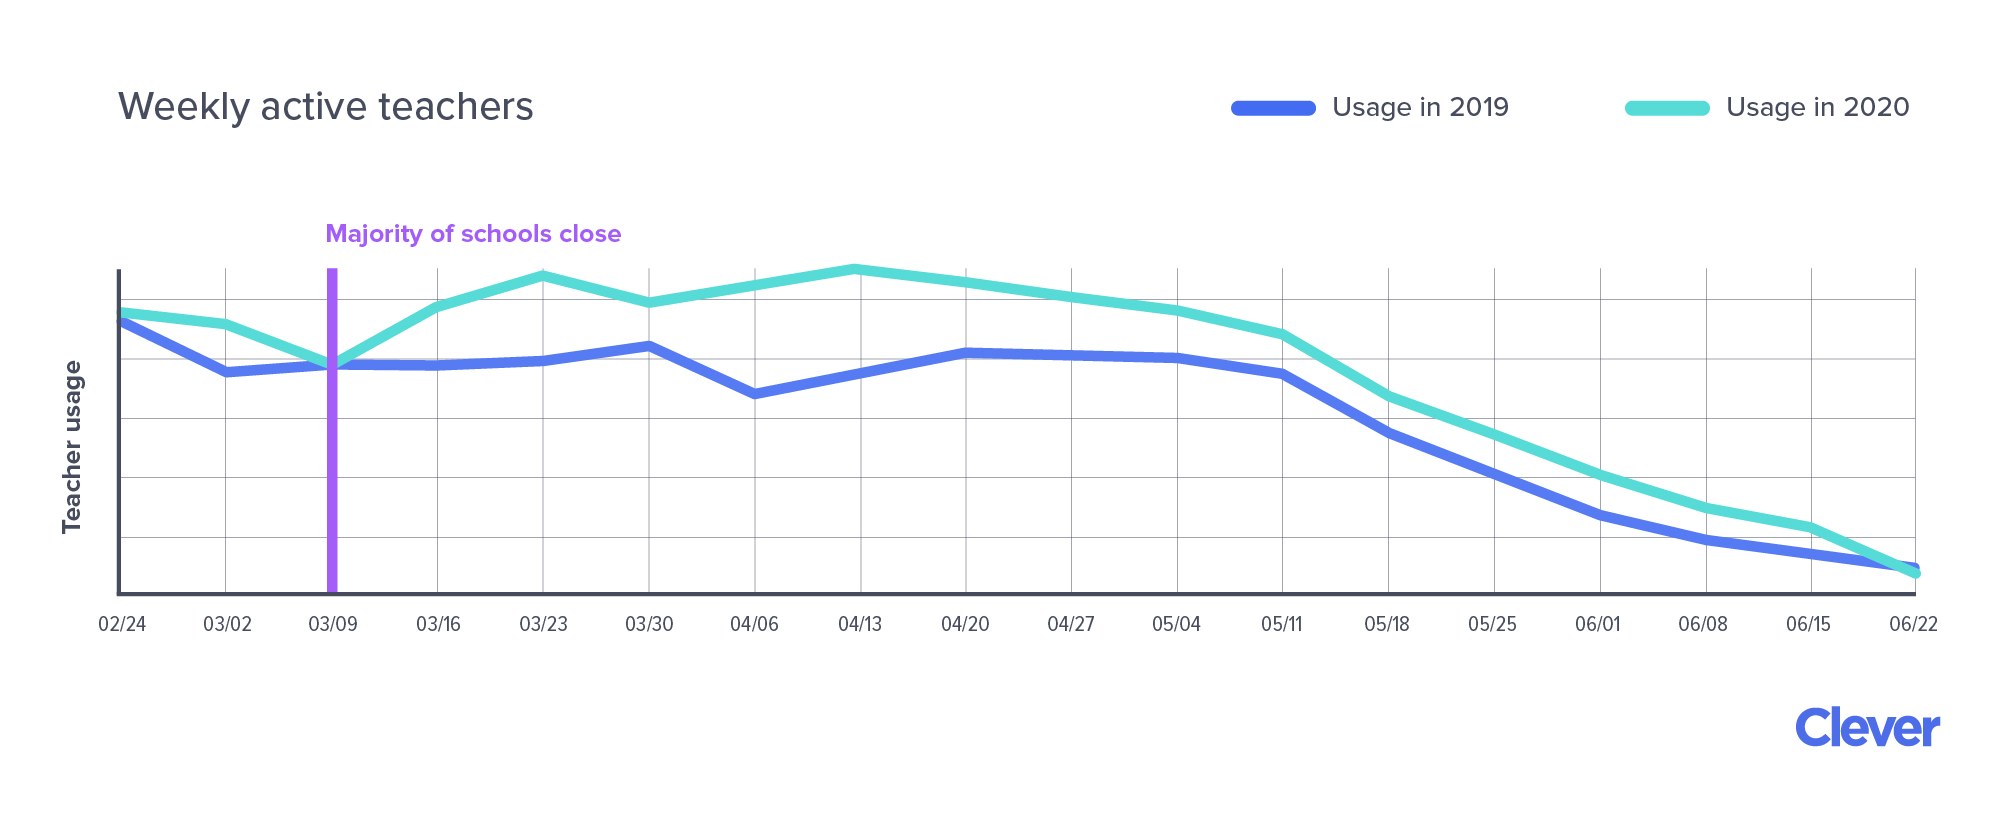
Teacher activity dropped, then increased
Wide variance in edtech activity by state
More evening logins with remote learning

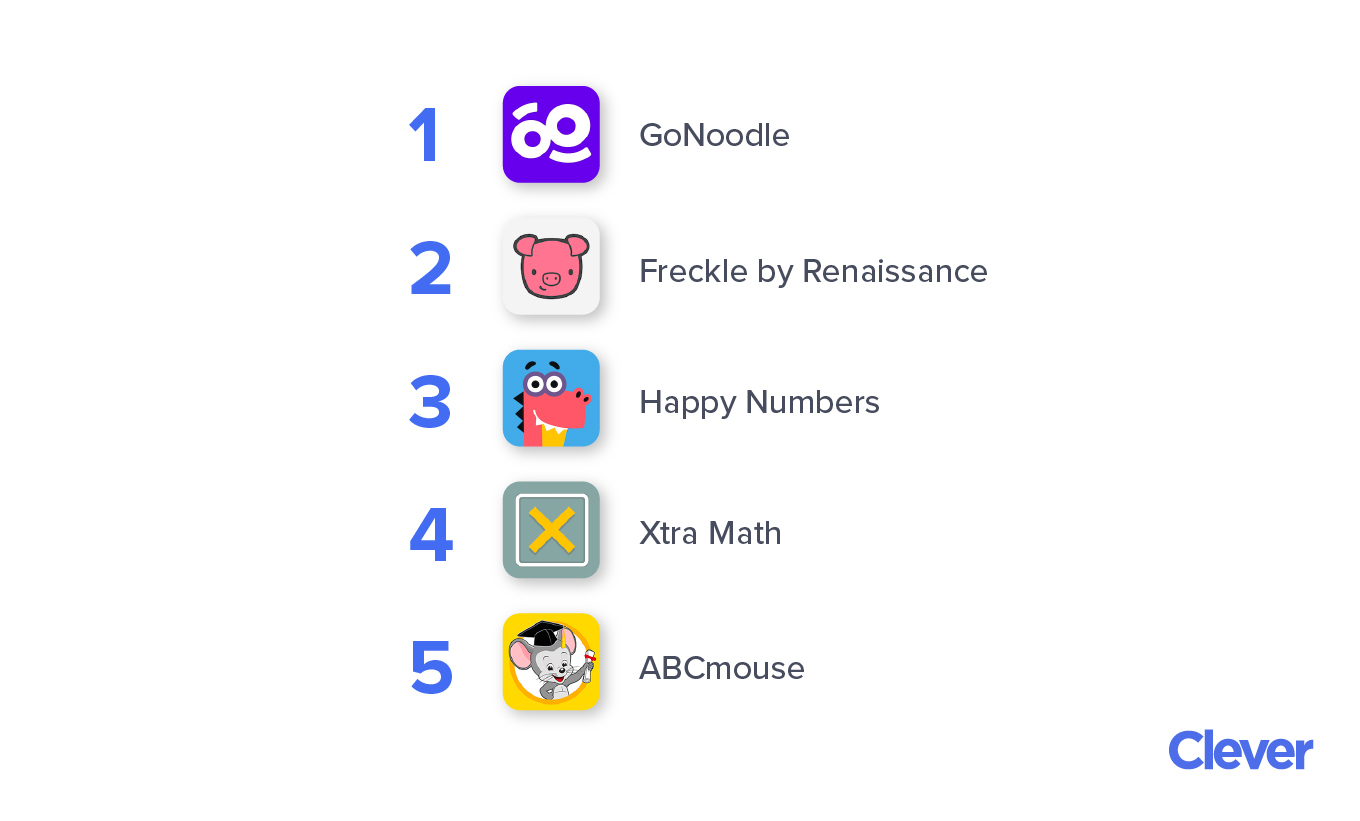
Fastest growing applications
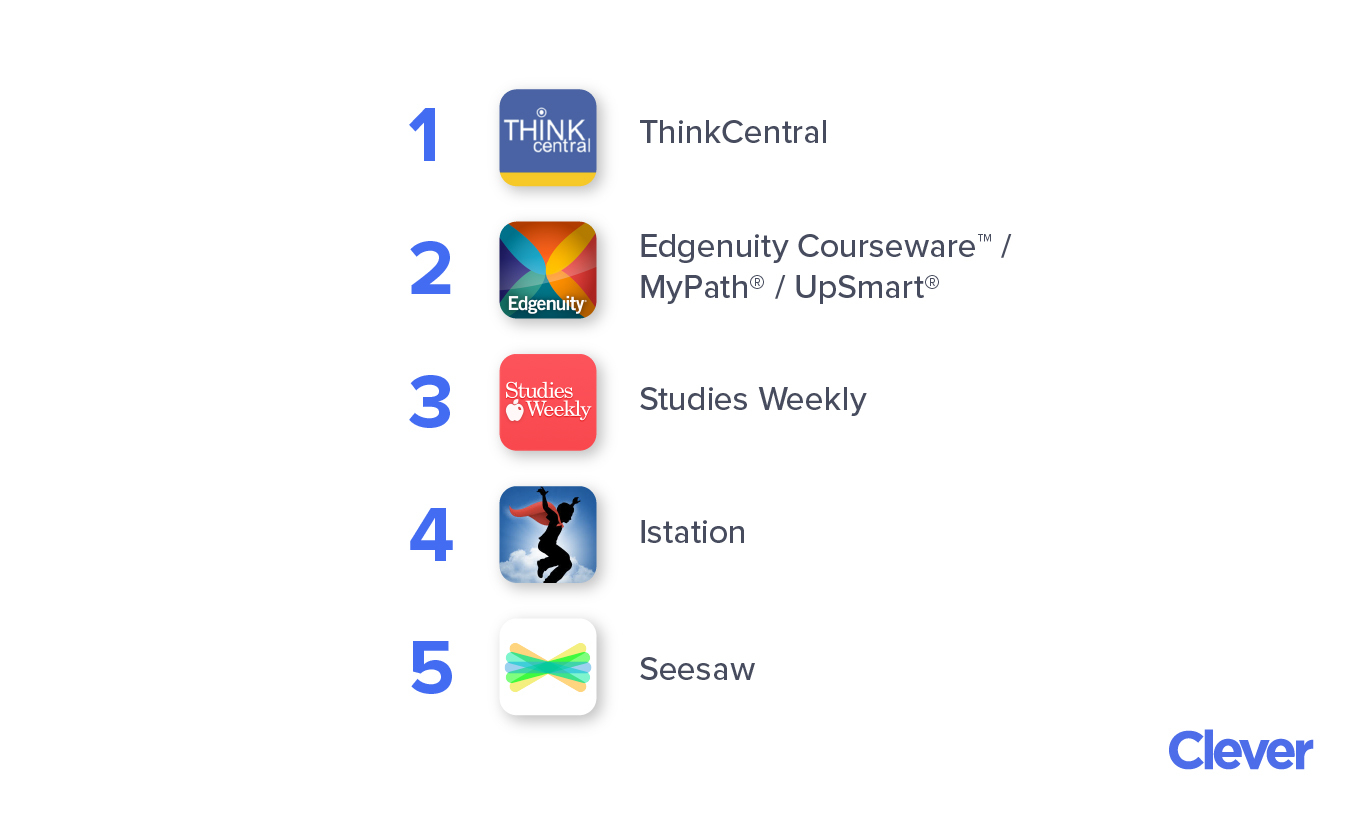
Growth for teacher-adopted applications
This report shows usage statistics by week, using the week of March 1 as the pre-school closure baseline. Active user metrics come from Clever Portal which is used by more than 15 million students and teachers monthly across all 50 states. Student and teacher activity is defined as the number of users with weekly activity on the Clever platform. To compare user activity year over year, we normalized the data by dividing it by the number of weekly active users in the last week of January of that year.
Growth applications measure the increase in student and teacher activity among edtech apps selected by their school districts. Applications installed for remote learning measures the increase in teacher signups for learning applications in Clever Library, a set of resources available within Clever Portal. Teachers have used Clever Library to create more than 40 million accounts for students.
Our Privacy Policy clearly explains how we collect, use, and share information. Our collection, use, and disclosure of Student Data is governed by our Terms of Use, by the provision of the Family Educational Rights and Privacy Act (FERPA), the Children’s Online Privacy Protection Act (COPPA), and applicable state laws that relate to the collection of Student Data. Read more about data privacy, security, and compliance in our Trust Center.
To help schools transition to remote learning, we partnered with Zoom to provide a premium video conferencing experience, launched a new tool for parents to help their children log in and learn from home, and more. Learn more about how Clever supports remote learning.